Performance Profile Summary
| Date / Time: |
10/01/07 10:36:18 |
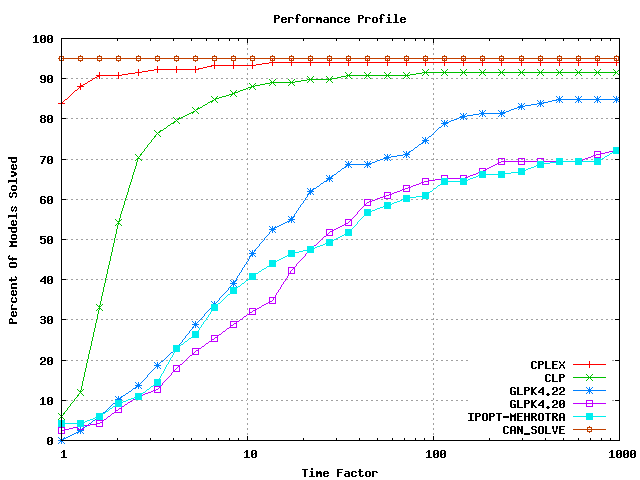
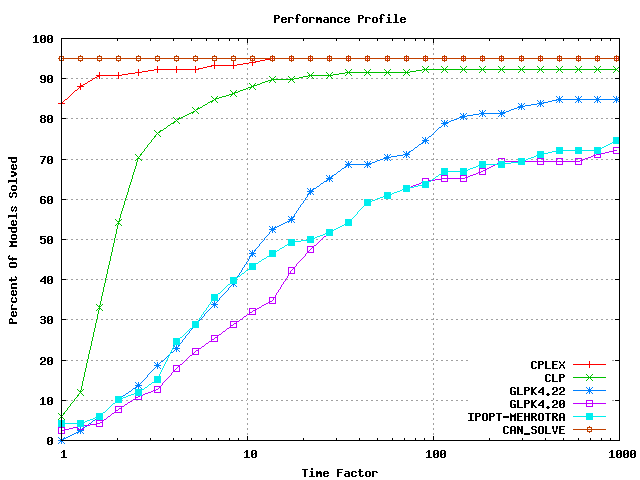
Performance profiles for different objective value tolerances.
The profile utility compares solver outcomes of any number of given
solvers (up to 8) over a model test set. The tool is described in detail
at
http://www.gamsworld.eu/performance/pprofile.htm.
A solver is considered feasible or optimal, if it has the proper model
and solver return codes and the relative objective value error is within
n % of the best possible solution. If the best found objective
value is 0, then the absolute objective value error is used.
The following relative objective value tolerances are used:
- Only best objective value (i.e. 0 % of best solution found.
Actual tolerance used is 1e-5 using relative error)
- No objective value tolerance, i.e. we do not check if obj is best found (within Inf%).
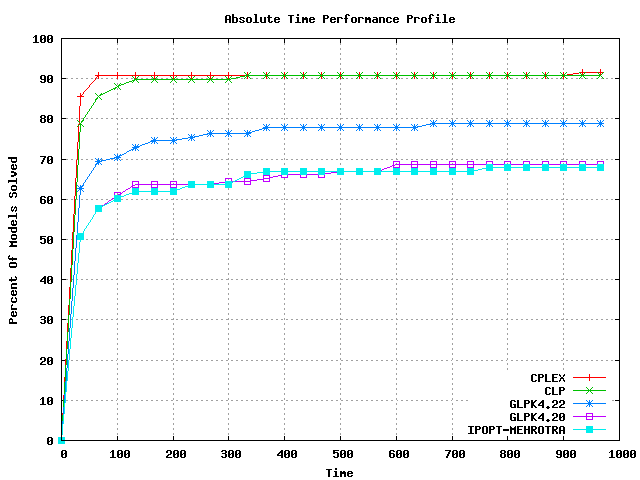
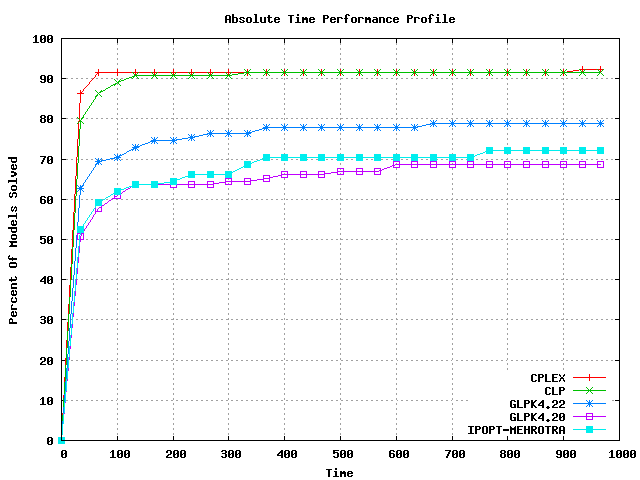
Absolute Time Performance Profile Summary
Below are absolute time performance profile plots. In this case, the
performance metric uses absolute time instead of the fastest solver time. That is
a model/solver pair passes if it solves the problem within the absolute time given.
Objective value tolerances used are the same as for the regular performance profile
plots as above.
There are curves for three additional super solvers shown:
- ALL_SEQ: solver consisting of all solvers run in sequence. Solver time
used is the sum of all solver times.
- ALL_PAR: solver consisting of all solvers run in parallel. Solver time
used is the max over all solver times.
- ALL_MIN: solver consisting of all solvers run in parallel. Solver time
used is the min over all solver times.